Measuring DOOH without web-ad shortcuts
A screen play is not a person, an estimated impression is not a click, and attribution is not proof. Here is a practical way to measure DOOH.
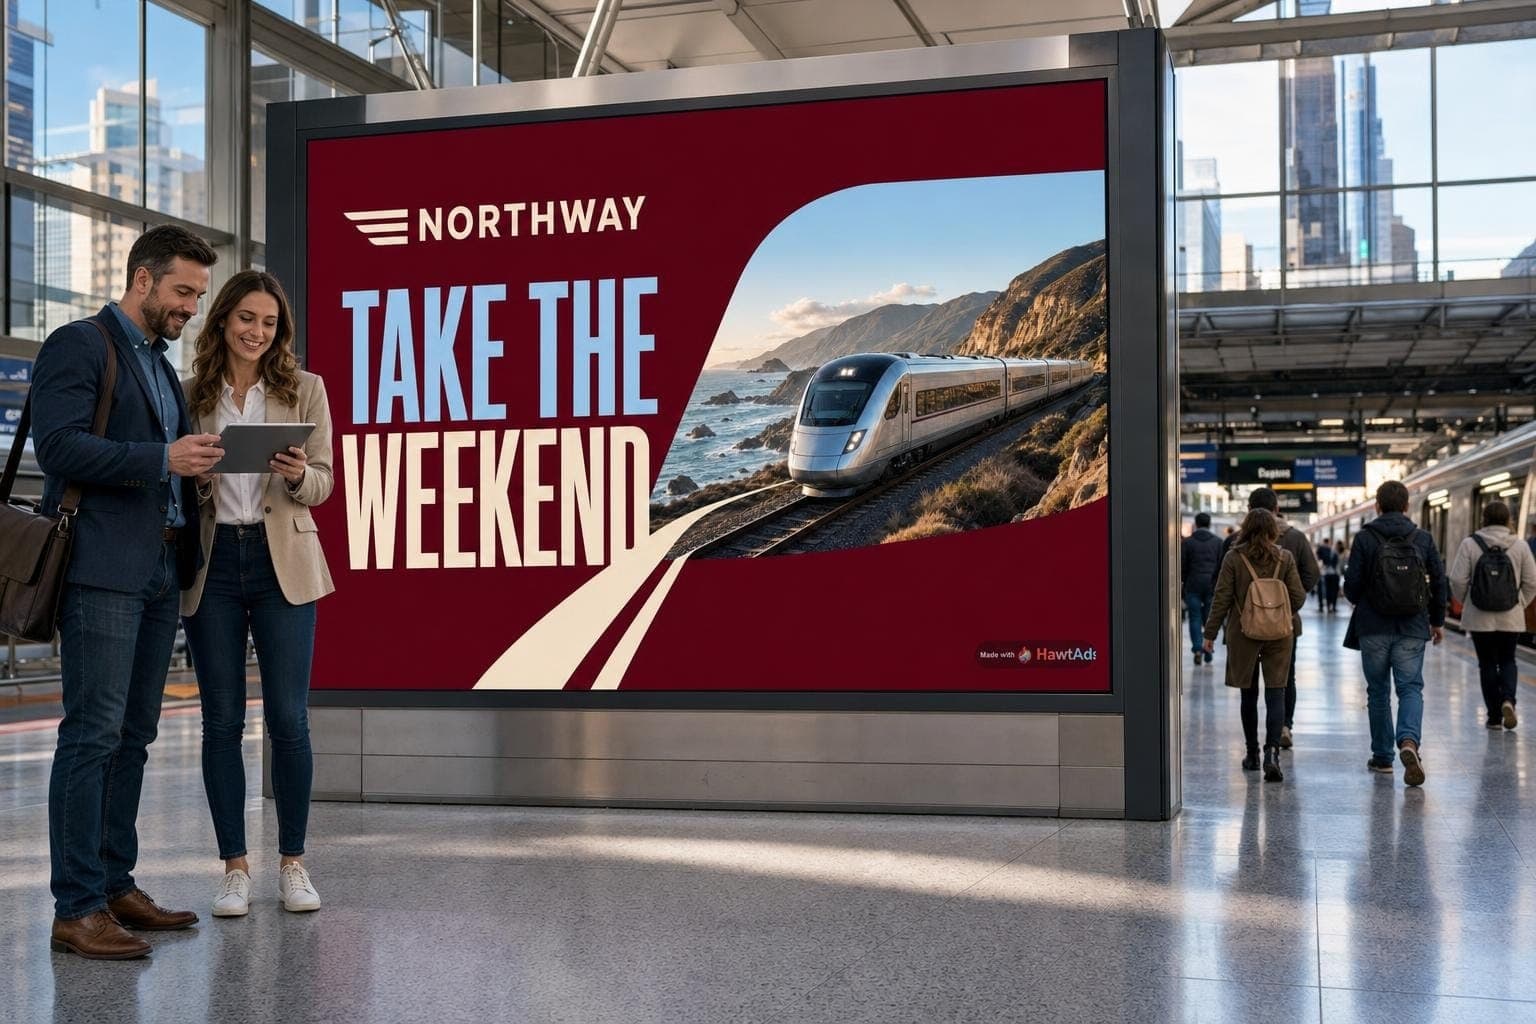
A digital billboard can play your ad 400 times without serving 400 people.
It might have been seen by 40,000 people. It might have been seen by far fewer. The answer depends on where the screen is, who was within viewing range, how long they were there, and how the audience estimate was built.
This is where familiar web language gets marketers into trouble. A browser impression is usually tied to one device loading an ad. A digital out-of-home screen can show one ad to a crowd, with no direct browser-style count for most of that audience.
Good DOOH measurement is not vague. It simply has different layers. Separate delivery from estimated audience, audience from action, and action from causal lift. Your report becomes much easier to trust.
Start with the four layers
The IAB Digital Out-of-Home Measurement Guide was published in July 2025 to address fragmented practices and inconsistent definitions across the channel. Its most useful lesson for an everyday marketer is that a valid impression needs more than proof that a file ran.
Think of a DOOH report as four related questions:
- Delivery: Did the approved creative play on the intended screen at the intended time?
- Audience: How many people had a reasonable opportunity to see it?
- Outcome: What happened afterward, such as a store visit, scan, search, or sale?
- Incrementality: How much of that outcome happened because of the campaign?
Each question needs its own evidence. A play log can answer the first one. It cannot answer all four.
A short glossary that will save a long meeting
Ad play or served impression: One confirmed showing of a creative on a screen. Google calls this a served impression in Display & Video 360. It is a delivery event, not a headcount.
Publisher impression: A screen play multiplied by the publisher's estimated audience for that play. Google's DOOH inventory documentation tells buyers to use publisher impressions for DOOH reporting and distinguishes them from served impressions.
Impression multiplier: The estimated average number of viewers for a play. The IAB measurement guide says the multiplier can draw on real-world inputs such as foot traffic, dwell time, and presence within the display's exposure zone.
Opportunity to see: A person's reasonable chance to see the display. It does not claim that the person paid attention, understood the message, or remembered the brand.
Reach: The estimated number of different people exposed during a period.
Frequency: The estimated average number of exposures per reached person.
Outcome: A business or behavioral event that happens after exposure. Examples include a store visit, branded search, app install, coupon redemption, or purchase.
Lift: The difference between what happened with the campaign and a credible estimate of what would have happened without it.
Those labels should appear in the report exactly as they were defined in the measurement plan. Geopath has warned that terms such as served, viewable, and audience impressions are often used for different things. Its advice is refreshingly basic: define the metric and make the method clear.
The math is simple. The input is the hard part
Suppose a kiosk records 100 plays. The media owner estimates an average of 12 people in the valid viewing area during each play.
100 plays × 12 estimated viewers = 1,200 publisher impressions
That does not mean 1,200 different people saw the ad. Some people may have been present for more than one play. Reach removes estimated duplication. Frequency puts it back in a useful form:
1,200 impressions ÷ 800 people reached = 1.5 average frequency
The arithmetic is not controversial. The multiplier deserves attention.
Ask who produced it, how often it is updated, which screen and daypart it covers, and whether it reflects the actual duration of your spot. Google's documentation is explicit that the multiplier is a publisher estimate. Google receives aggregated screen-level multipliers, not user-specific measurement data, and advises advertisers to understand the supplier's method and consider third-party verification.
For US campaigns, Geopath is one important source of standardized OOH audience measurement. Its planning guidance says buyers should define the audience and parameters clearly so responses from different media owners remain comparable. The Geopath standards and best practices document also recommends being precise about geography, inventory, timing, and the audience profile used.
In plain English, do not compare one vendor's estimated adults 18-plus in a weekly market plan with another vendor's all-person hourly estimate and call them the same CPM.
Build the measurement plan before the creative ships
A workable brief fits on one page. Write down these items before launch:
- Business objective: Awareness, store traffic, product trial, ticket sales, or another outcome.
- Primary audience metric: Plays, impressions, reach, frequency, or some combination, with definitions.
- Audience and geography: The exact population, markets, venues, and screen set.
- Time: Flight dates, dayparts, spot length, and the reporting time zone.
- Data owner: The party providing play logs, multipliers, audience estimates, and outcome data.
- Outcome window: How soon after an exposure a visit or sale can reasonably count.
- Comparison: Holdout markets, unexposed audiences, pre-campaign baseline, or another counterfactual.
- Privacy rules: What data is collected, at what level it is aggregated, and how long it is kept.
If a metric cannot be explained in one sentence, keep asking questions. “Engagement” is not a KPI until everyone knows what action it counts.
Do not promote attribution into causation
An exposed device that later appears at a store is an attributed visit. It may be useful evidence. It is not automatic proof that the ad caused the visit.
The person might already be a customer. The store might have run a promotion. The weather might have changed. A competing channel might have done the convincing. Measurement gets stronger when it includes a comparison group, controls for obvious differences, and reports uncertainty instead of hiding it.
The right method depends on the budget and decision:
- Use a brand lift study when the main question is awareness or consideration.
- Use matched markets or a geographic holdout when sales can be compared across similar areas.
- Use store-visit or sales attribution when the data and consent basis are appropriate, then label it attribution.
- Use marketing mix modeling for a broader view across channels and longer periods.
- Use a simple before-and-after comparison as directional evidence, not as a causal verdict.
QR codes and short URLs can add a direct response signal, but they measure scanners and typers, not the full audience. A board can work even when nobody stops on the sidewalk to scan it.
Generated creative needs its own audit trail
When many versions are selected or generated from context, the measurement table needs one more key: the exact creative decision.
The HawtAds Ads Engine is designed around the path from permitted signals to a creative for a particular screen and moment. To evaluate that system, marketers need to retain the version shown, screen ID, play time, applicable context, rule set, and decision reason. Otherwise, a good result cannot be connected back to what the audience actually saw.
This also makes testing more useful. Instead of lumping every generated version into “AI creative,” compare meaningful choices. Did a morning offer beat a generic offer? Did local inventory messaging improve store visits? Did a shorter headline work better on roadside screens while the longer line worked in a waiting area?
The engine can help make variants. The experiment still needs a hypothesis and a fair comparison.
A report an everyday marketer can use
Your weekly dashboard does not need 60 columns. Start with:
| Question | Useful fields |
|---|---|
| What ran? | Plays, screens, dates, dayparts, creative IDs, failed plays |
| Who could see it? | Estimated impressions, reach, frequency, audience definition, source |
| What happened? | Visits, scans, searches, conversions, revenue, attribution window |
| Did it add value? | Control result, lift, confidence range, cost per incremental outcome |
Add a note when data is modeled, delayed, or unavailable. That note is not a weakness. It keeps a forecast from masquerading as an observation.
Google also notes that DOOH reports can lag and that geographic targeting based on a screen's IP address may not always match the screen's physical location. That makes screen-level delivery checks worth doing, especially in a local campaign.
Measure the medium you bought
DOOH is valuable partly because one play can reach many people in a real place. That strength is exactly why a browser-shaped report does not fit.
Count the plays. Estimate the audience with a method you can explain. Connect exposure to outcomes carefully. Use a control when the business decision demands causal confidence. Then preserve the exact creative and context that produced the result.
The result is not a perfect view of every person. It is a useful, defensible view of the campaign.
For the privacy choices behind that measurement, read Personalization without the creep factor. The next article in the series covers the production records that make creative-level reporting possible.
See how HawtAds connects signals, decisions, and creative records on the Ads Engine product page. Then try HawtAds free to carry the messages that perform into social, display, and app-store placements.
Frequently asked questions
What counts as an impression in DOOH?
The word can refer to different layers. A served impression or ad play confirms that the creative ran once. A publisher impression applies an audience estimate to that play. A useful report labels which definition it uses and where the estimate came from.
How do marketers measure whether DOOH caused a result?
Use a comparison that estimates what would have happened without the campaign. Depending on the goal and budget, that might be a matched market, geographic holdout, brand-lift study, or another controlled design. Attribution alone shows a relationship after exposure, not necessarily incremental impact.
Should a DOOH report include the exact creative version?
Yes, especially when messages change by screen or context. Connecting each play to a creative ID, decision record, and applicable input lets marketers compare real choices instead of treating every version as one generic campaign.